A Business Can Look Busy
While Quietly Losing Millions
Gain complete visibility across branches, products, and teams,
and uncover six- and seven-figure inefficiencies hiding in plain sight
Here's the truth. If you can't answer these questions with certainty:

Which locations actually generate profit (not just revenue)
How they make it, and how they lose it
Which teams drive real results, and which fall behind
Which products/services drive real profit, not just sales
Who your most loyal and valuable customers are, not just foot traffic
Then you're likely losing money in ways that won't show up until month-end — if at all
Pay close attention
You didn't build multiple locations to spend your weekends buried in spreadsheets, or wondering if you're making the right calls.
You built this to grow. To scale. To finally have the freedom that comes with a business that runs on systems, not gut feel.
But instead, you're making million-dollar decisions in the dark—hoping your instincts are right, praying that some locations isn't quietly draining the profits from your best performers.
I want to show you exactly where your business is bleeding profit, by branch, product, or team—so you can finally stop second-guessing every decision.
And not just that.
You stop reacting to problems months after they started.
You stop discovering at tax time that half your growth evaporated into waste you never saw.
You stop lying awake wondering if you’re overstaffed, understocked, or quietly leaking profit.
For six years, I worked alongside investment firms that acquire multi-location businesses with growth potential.
Before scaling or selling those companies, they had one priority: uncover operational inefficiencies quickly, fix them decisively, and sell them for a higher price
Today, we use that same framework to uncover six- and seven-figure savings opportunities hiding inside normal operations across your growing businesses.
And you get all of this without hiring a data team, learning new software, or adding more to your plate.
Just clarity. Control. And the confidence to grow without the constant second-guessing.
But here's where things get really interesting…
When you can see exactly where your business is leaking profit without
spreadsheets, guesswork, or delayed reports…
You suddenly operate with real visibility.
A level of visibility that, in real-world cases, has resulted in:

$740K recovered from one underperforming branch
$480K cut in overstaffing in a single quarter
Up to $1.8M unlocked in margin improvements
Faster, data-driven decisions instead of gut feel and weeks-late reactions
that quietly cost hundreds of thousands
These profit leaks exist for one simple reason:
Most businesses look at their data in isolation
Sales data shows revenue, not profit.
Marketing data shows clicks, not paying customers.
Accounting shows totals, but not which branch or product makes money.
Payroll alone shows cost, but not if staff are actually productive.
The real answers only appear when systems overlap.
Sales + Accounting shows which products and locations actually make money.
Sales + Marketing proves which campaigns create profitable customers.
Sales + Payroll shows revenue per labor hour. Who's a star and who drags you down.
Sales + Inventory shows what product moves and what dies on shelves.
Sales + Inventory shows what product moves and what dies on shelves.
Sales + Customer data Spots loyal customers,why they buy, and how to keep them
Alone, each system is a clue.
Together, they show you exactly where to act, what to fix, and where to scale.
to piece this together in a spreadsheet - but it's slow, fragile, and heavily dependent on
manual work. One broken formula, one outdated file, or one “adjustment,” and the
numbers stop telling the truth.
This Is Where Competence Analytics Comes In
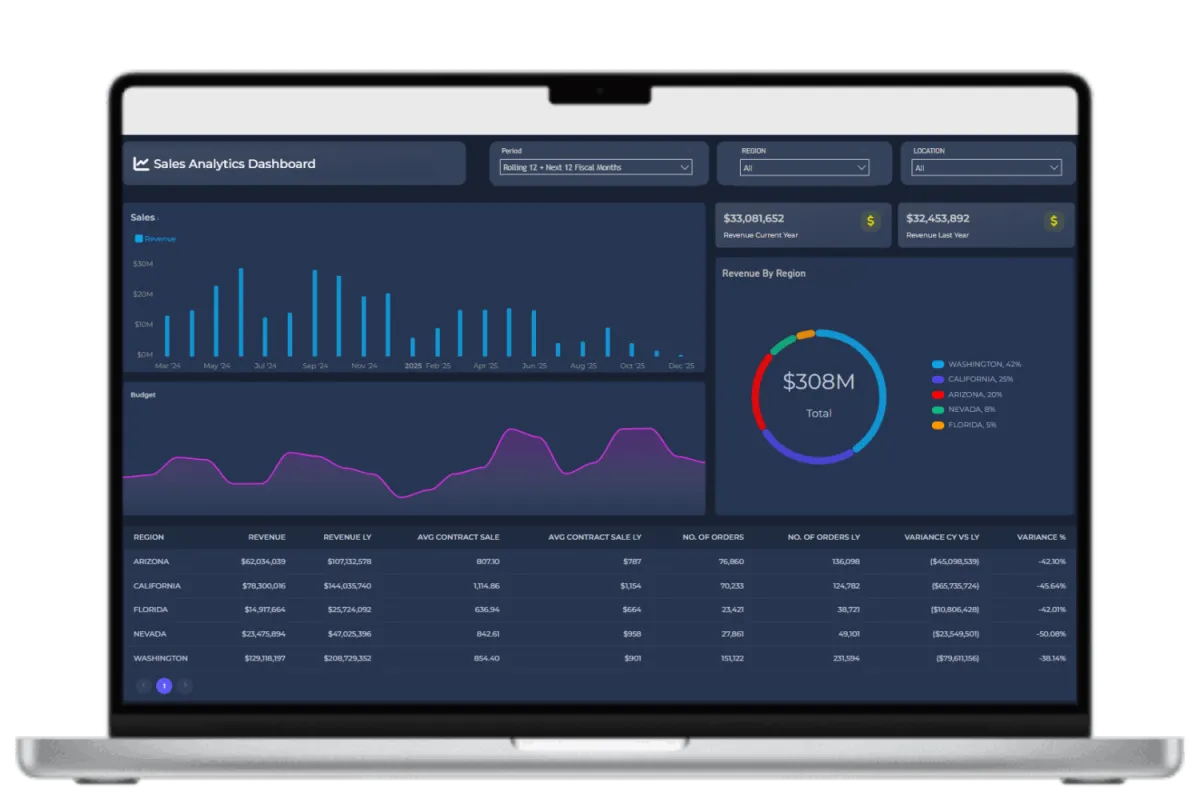
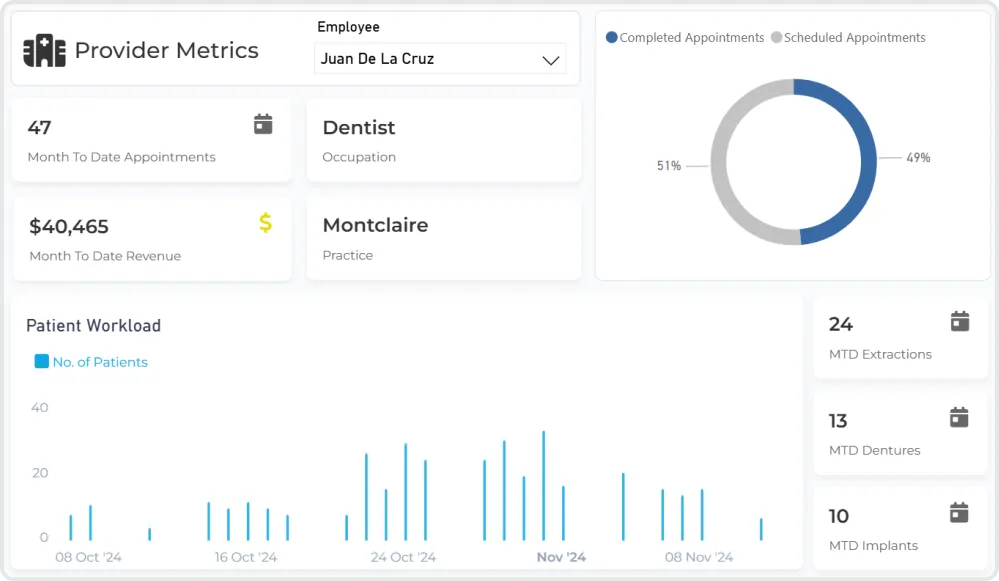
We help you take control of your business by connecting your existing data across your systems and projecting it into one clear, executive-ready view designed specifically for your business
So instead of walking into leadership meetings with partial data and gut feel…
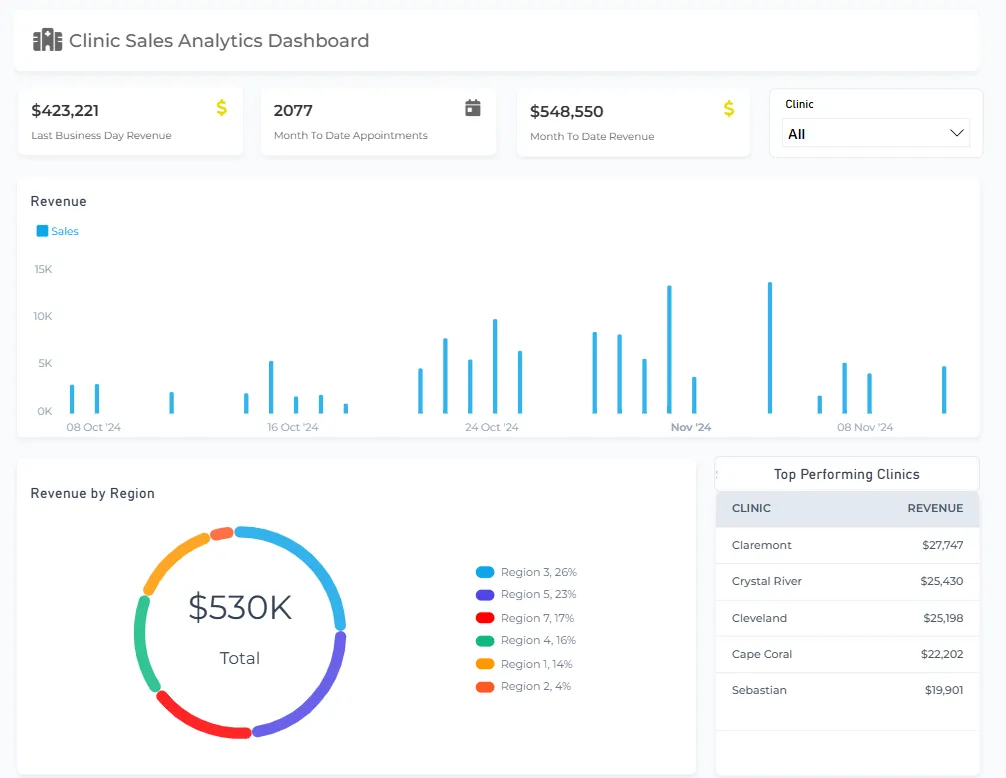
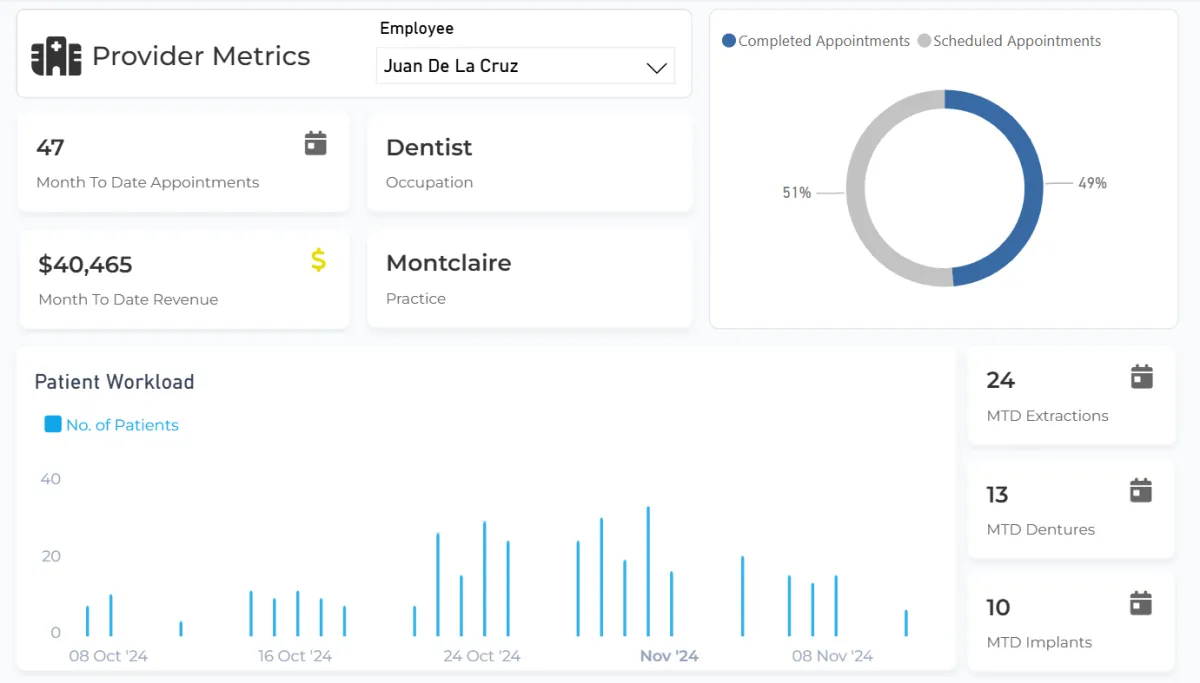
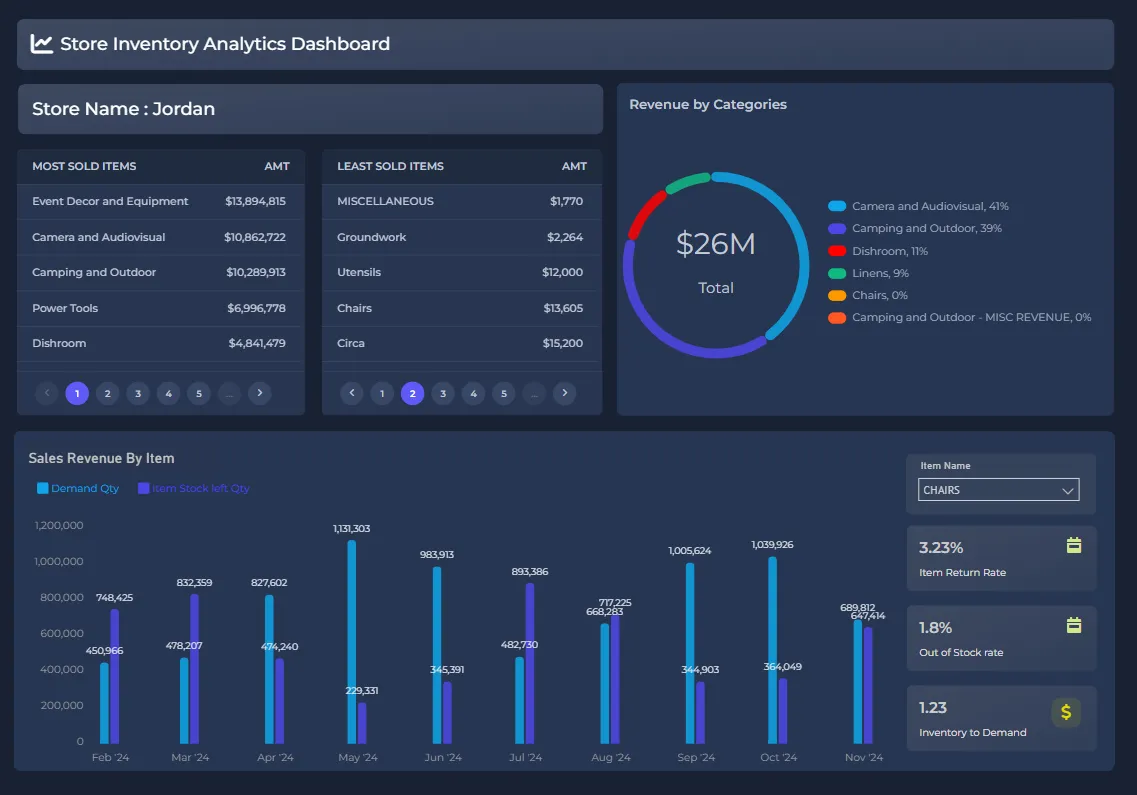
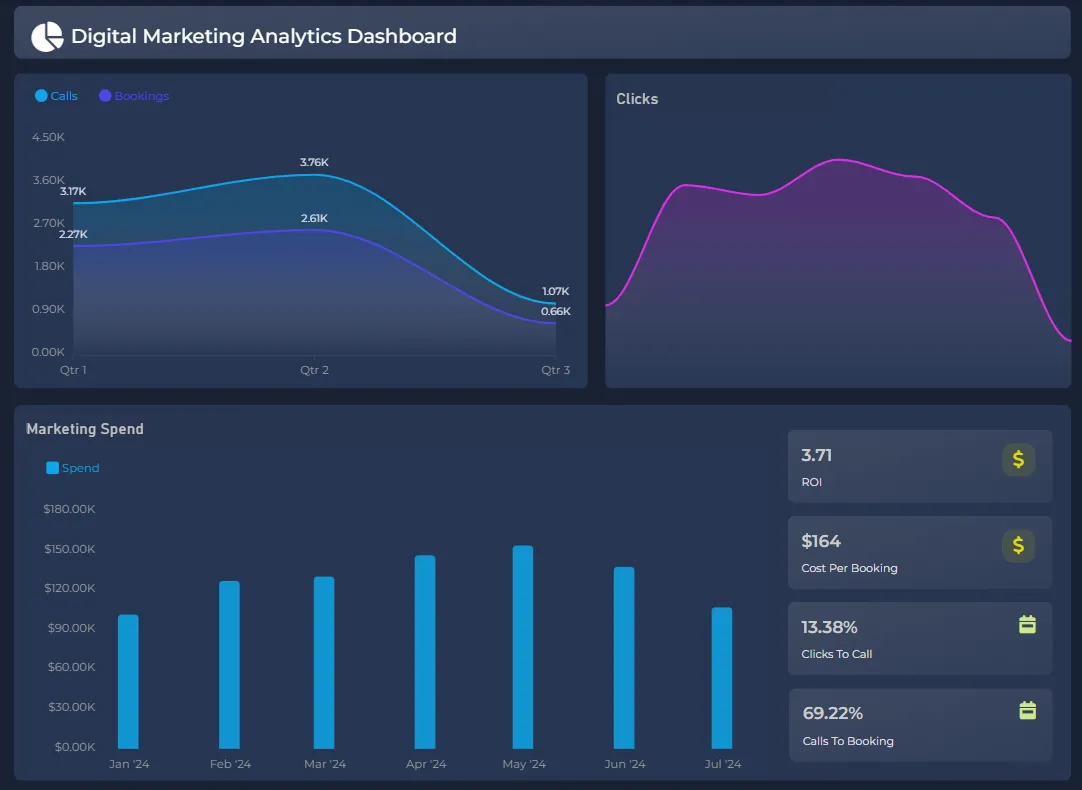
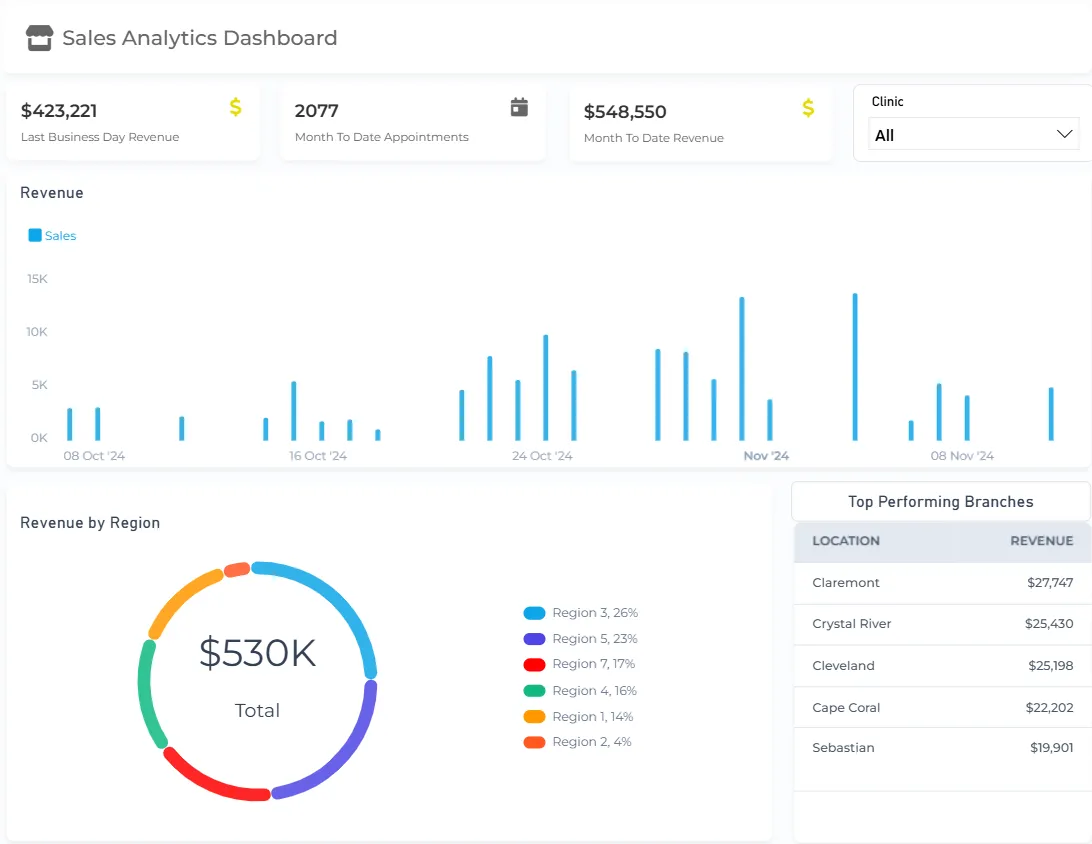
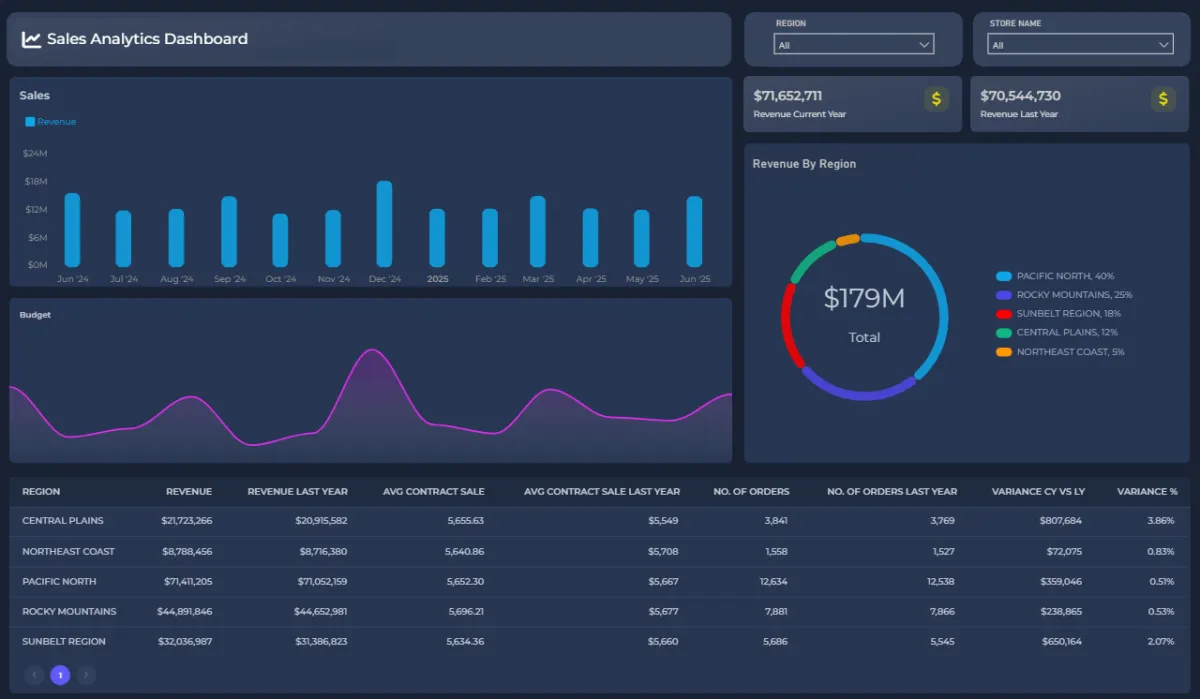
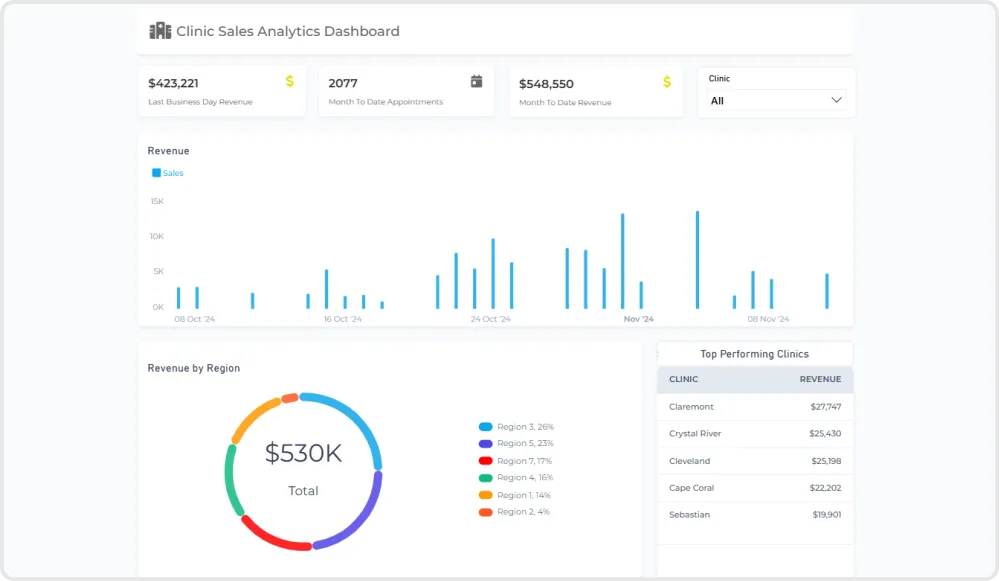
Sample dashboards used by clients. Data has been anonymized and modified for security
You walk in knowing exactly what's underperforming, what's working, and where to act next.
Here's How it Works

We connect your existing systems data into simple views that update automatically

You instantly see where profit is leaking - by branch, product, or team

You get plain-English insights on what's working and what's not

We set automated alerts when KPIs slip

You catch problems early - before they show up in your P&L
If you’re running multiple locations and don’t have absolute clarity on where profit is being made, or lost
This is worth a conversation.
A 30-minute working session to identify where profit is leaking across your locations,teams, or products.
Insights drawn from work across multi-location businesses


The Competence Analytics Dashboard In Action
Profit Leak Detection
Silent Margin Finder
See exactly where money is slipping through the cracks across locations, teams, and products.
Real-Time Staffing vs Output Overstaffing Eliminator
We show where payroll is outpacing productivity. You see where $480K can be saved without layoffs.
Loyalty & Retention View
We connect customer data with sales to reveal who your best customers really are.
You see:
Which customers return and spend more over time
What they buy, how often, and why they come back
Which customers look busy but never turn profitable
This lets you:
Increase repeat revenue without increasing ad spend
Focus retention efforts on customers that actually matter
Sales + Inventory shows what product moves and what dies on shelves.
Stop treating all customers as equal when they're not

Boardroom Readiness – Executive Clarity Builder
One weekly 10-minute view. You walk into meetings with answers, not guesses.

Smart Alerts – Early Warning Engine
We alert you when KPIs start slipping. So you act before small problems become expensive ones.
Know Exactly Where You're Losing Money - Without Spreadsheets, New Software, or Guesswork
You finally see:
Which branches print money
Which teams and staff are underperforming
Which products are profitable and which drain profit
Who your most loyal customers are, why they buy and how to keep them
All in one place. Updated in real time.
ARE YOU READY TO SEE EXACTLY WHERE YOUR BUSINESS IS LEAKING PROFIT?

We build everything for you

We connect your existing systems into one clear, executive-ready view

You spend less than 12 minutes a week reviewing one simple dashboard
And as a result, businesses typically uncover:

Tens of thousands to millions in silent profit leaks

Overstaffing before payroll balloons

Underperforming units before they drain margins
All without spreadsheets, extra staff, or guesswork.
HOLD YOUR TEAMS ACCOUNTABLE WITHOUT MICROMANAGING , AND REMOVE SURPRISES FROM YOUR P&L

Real-time visibility by branch, team, and product

Plain-English KPIs that show performance at a glance

Automated alerts when numbers slip - so you act before problems grow
This is how you gain control over operational profitability.
And control is what drives faster decisions, higher margins, and confident growth.
Less Guessing. More Control.
In 30 minutes, see exactly where profit is being made, where it's leaking, and what to address next.
Insights drawn from work across multi-location businesses